For a while now, we’ve been battling some performance problems with our node.js backend. We’d see some parts of our application start slowing down, and we’d get reports from internal users that everything was taking longer and longer.
It was frustrating as when we attempted to replicate it, we often couldn’t see it – most parts of the application were working normally, endpoints were responding quickly, and nothing in our metrics looked really out of alignment. There was some slightly higher-than-usual memory usage but nothing that really stood out.
All we knew was that the tried and tested “turn it off and on again” trick would fix it, so when these complaints came in we resorted to simply restarting the application server.
Finally – we can reproduce it!
Eventually, we were able to drill in on one specific endpoint that would always manifest this slow behaviour. It was a fairly simple endpoint, just pulling some email templating into, but under certain conditions it would slow down dramatically, meaning the team that relied on that endpoint would start slowing down.
Once we identified this endpoint we were able to look at some historical data which made the issue a little more obvious. This snapshot from Sentry shows the duration increasing dramatically over a course of a few hours (the big gap in the middle is a weekend).
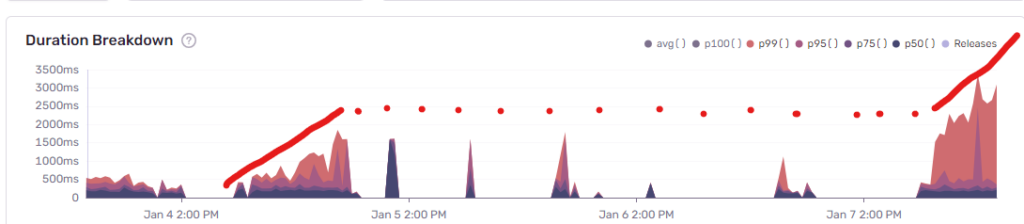
This particular endpoint was almost doubling in time it took to run every single day. So within a few days of a fresh restart, suddenly our users we having to wait 8-10 seconds for a response when making a basic change.
(There’s an obvious question here: how did we not notice this sooner?! You’d think an endpoint that was flailing out of control would be immediately noticeable. Part of the problem was that, sadly, we have a lot of slow endpoints, so there’s a lot of noise. Most other endpoints were not exhibiting this same behaviour, so it wasn’t until we identified it that we noticed this pattern. And ultimately, the application was restarting every few days because of new releases, so it never spiralled massively to the point where it stood out head and shoulders above everything else.)
Diving into metrics
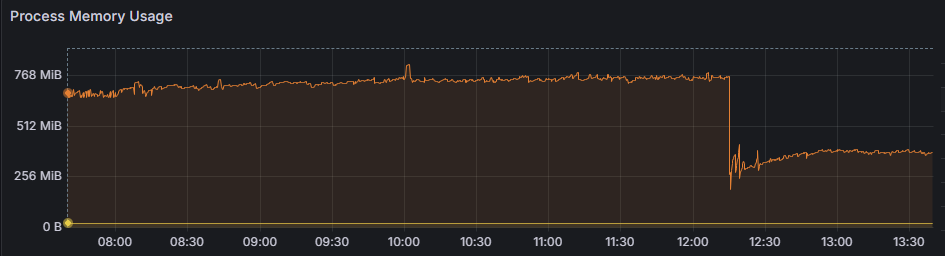
From here we started at looking in more detail at node’s memory usage. The below graph is a typical example – there’s a slight memory increase over time. Once the process memory usage hits a certain point, we’d see performance drop off suddenly. We’d restart (seen below around 12:15), memory use would drop significantly, and performance would be back to normal.
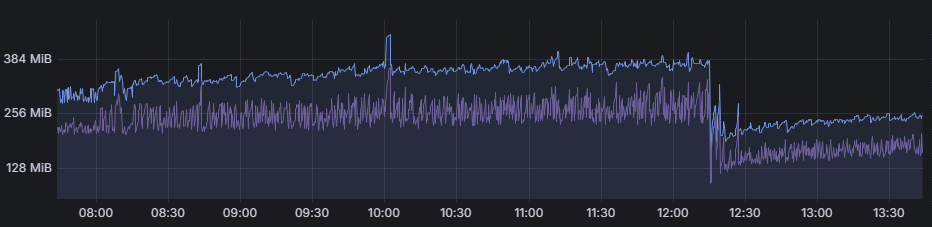
The heap showed similar characteristics (heap total & heap used):
It seemed likely that there was some sort of memory issue going on here, but there weren’t any other obvious issues. There was no significant page faulting and the servers were otherwise snoozing – low CPU and plenty of free memory.
We didn’t seem to be butting up against the heap size limit – we’d see occasional bigger spikes above the “slow threshold” for particular reporting calls, which would seemingly work without major issue, but we were clearly hitting some limit.
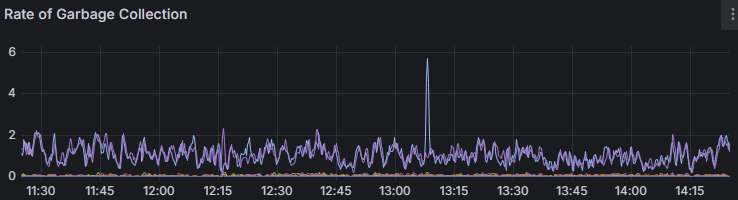
The official node.js website has a memory page which looks at memory issues, possibly symptoms, and provides some guidance on how to debug them. But we weren’t seeing some of the symptoms here. For example, node’s internal garbage collection stats looked fine – very constant, with no peaks or even significant increases visible around the slowdown periods:
We also weren’t seeing straight-up process restarts or crashes, or other signs of complete memory exhaustion. The operating system wasn’t reporting significantly increased page faults and CPU usage was unremarkable.
Could it be memory fragmentation?
It seemed likely there was some sort of memory leak causing issues here. The possibility of memory fragmentation popped up after reading this really interesting article on topic on the LinkedIn Engineering Blog. While it didn’t seem super likely, we thought it might be interesting to at least look at, just to see if there were any issues on that front, if only to rule it out.
We found this interesting tool called processes2png, written in Rust, to visualise memory usage on a Linux machine. Running this over a day or so gave us some interesting results, which have been converted into this video:
You can see memory continue to get allocated throughout the life of the application. There are a few moments where the allocated memory vanishes and starts re-appearing – this is a result of trying a few things, like compacting memory and dropping caches:
# echo 1 > /proc/sys/vm/compact_memory
# echo 3 > /proc/sys/vm/drop_caches
While the visual impact of those changes is very noticeable, as seen in the video, it didn’t make any significant impact to the performance.
This seemed to rule out memory fragmentation as a potential cause for the slowdowns we were seeing (… which was never really hypotheses #1, but it was fun mucking around with these tools to find out).
What now?
This has led us to the conclusion that it’s some sort of unusual behaviour as a result of a gradual memory leak – once it hits some threshold, we start seeing the poor performance, but it is not displaying the other documented symptoms that would usually be associated with memory exhaustion.
Our next steps will be to start going down the usual process of investigating memory leaks – heap profiling and looking at code for what seem to be the three most common causes (global variables, event listeners, closures).
In the meantime, we’ve put alarming on the endpoint that is reliably symptomatic. Once it crosses a certain pain threshold – currently two seconds response time – a flare goes up. And just turning it off and on again will be the fix for the short term. It’s low tech, but it works.