Continuing our investigations into our memory problems with our node.js servers, we found several references that indicated some people had had success solving random memory leak problems with jemalloc, a replacement for the default glibc memory allocator.
This seemed like a fairly easy and low risk change so we thought we’d give it a go just to see if it had any immediate and noticeable impact.
Before going into the implementation details and so as not to bury the lede any further: this didn’t solve our problem. We still are seeing consistent memory leakage, so the problem seems to be very much in our code, and our next step will need to be a more exhaustive investigation into the most common causes of memory leaks in JavaScript.
(That’s not to say it won’t fix your problem, of course – just that it didn’t fix ours.)
We are running our node.js servers on AWS EC2, under Elastic Beanstalk. Deploying jemalloc there is pretty easy, at least if you’re running Amazon Linux 2 (AL2):
- In your .ebextensions directory in your project create a new file, like 15_jemalloc.config
- Add the following code:
container_commands:
  01_install_amazon_epel:
    command: |
      amazon-linux-extras install -y epel
  02_install_jemalloc:
    command: |
      yum install -y jemalloc-devel
  03_set_ld_preload:
    command: |
      echo "/usr/lib64/libjemalloc.so" >  /etc/ld.so.preload
This won’t work with the more recent Amazon Linux 2023 as it does not support the EPEL repositories – it’s possible jemalloc is available in the default package management system by the time you read this, but it wasn’t when I was testing, so might need to be compiled from source.
After a restart, you can confirm jemalloc is running by doing an lsof -p [node.js PID] and making sure jemalloc is listed in the results. This Github issue also has some useful ways to determine whether jemalloc is in play or not. For example, running something like:
MALLOC_CONF=stats_print:true node -v
… will print the jemalloc stats for that command.
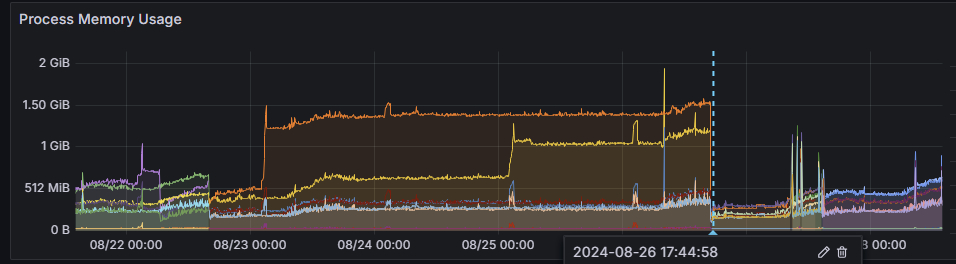
The following image shows our initial results – the dotted blue line shows where we restarted the service with jemalloc set up, but you can see memory usage starts creeping up immediately afterwards, and we continued to see similar issues as before (for example, the sudden spike at midnight 08/23 is indicative of something that is probably more than a bit of casual memory fragmentation).
This pattern continued over time and we found ourselves needing to restart the server every two to three days as the increasing memory usage slowly increased page response times until they made our application become very unwieldy to use.
While jemalloc wasn’t a magical silver bullet for our problems, it was interesting learning about its existence and looking at how it can be used to diagnose memory issues. This great article on the LinkedIn Engineering Blog goes into some detail about how jemalloc can be used in conjunction with other tools to zero in effectively on where leaks are occurring, so we plan to keep it deployed while we start looking for time to diagnose further.
In the meantime, as always, turning it off and on again is saving the day.